Support and Resistance Indicator- A Beginner’s Guide
In the world of trading forex, following a well-defined strategy is fundamental. Understanding and effectively using the support and resistance indicator concept might be considered a helpful tool in forex trading. However what does this exactly mean, and how can you apply this approach in practice? Keep reading to learn the truth about the support and resistance indicator levels.
Support: The safety net
Imagine the trapeze artists at a circus. The net beneath them is the safety mechanism, which may prevent them from hitting the ground. In the trading sphere, ‘support’ could be that net. The price that an asset rarely falls below is denoted by this term. In other words, it’s the point at which the price tends to bounce back due to increased demand or buying pressure. To find the most accurate signal for support and resistance, it may be necessary to identify these levels.
Resistance: The glass ceiling
On the flip side, resistance can be thought of as a glass ceiling that the price struggles to break through. It’s the point where the price of an asset usually peaks due to increased selling pressure. The price might be restrained by a strong resistance level, potentially preventing further price increases.
Zones of Influence: Support and Resistance indicator zones
Often, traders may think of support and resistance as zones rather than specific levels. A resistance and support indicator may not always be an exact figure. These ‘zones’ can give some leeway and be a more practical way to view these critical price levels. To make informed trading decisions, the support and resistance forex indicator can be used to locate these zones. The support and resistance indicator may be used to identify these zones, giving traders greater flexibility and potential.
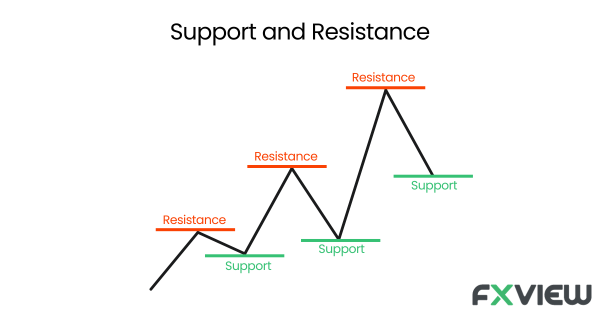
The dynamics of price movement: Support and Resistance
Support and resistance indicator levels are a manifestation of the basic economic principle of supply and demand. Prices increase until they reach a resistance level when demand exceeds supply for an asset. Conversely, when the supply of an asset surpasses its demand, the price falls until it hits a support level.
Imagine a concert with limited tickets. When the price reaches a certain level (known as “resistance”), buyers will no longer accept a price increase as a result of increased demand for the tickets. Conversely, if the concert fails to draw interest, the price of the tickets drops until it hits a level (support) where people consider it a good deal and start buying.
How do Support and Resistance work?
The support and resistance indicator operates under the classic law of supply and demand. When demand surpasses supply, prices may rise, hitting resistance. Conversely, when supply outnumbers demand, prices may drop until they find support.
Imagine being in a crowded auction. The bidding price for a painting goes up until it reaches a point where no one is willing to bid any higher – that’s the resistance. On the other hand, when a product is undervalued, buyers swarm in, increasing the price until it hits the support level.
Are they foolproof? Support and Resistance reliability
In the hands of a skilled trader, the indicator for support and resistance is a mighty weapon. But there have been some arguments about its dependability. Despite the fact that these levels are not foolproof, they do offer helpful information regarding market patterns and probable reversals. For a more reliable analysis, combine them with other tools and indicators.
These limits were established using historical data, thus they do not predict future performance. They do provide a means of understanding the psychological standard of the market participants, though. They can potentially improve your trading approach when used in combination with other technical indicators.
Mastering the art: Tips on Support and Resistance
- Leveraging the support and resistance indicator boils down to the following key practices:
- Identify the levels: Use a line chart to clearly visualize the support and resistance indicator levels.
- Consider the bigger picture: Multiple testing of support or resistance levels can hint towards a more significant price move.
- Utilize other indicators: To indicate a breakthrough or bounce, you can use additional tools like moving averages or momentum oscillators.
- Look at the frequency: The more times a price touches support and resistance levels without breaking, the stronger these levels could be considered.
- Use in conjunction with other tools: Use support and resistance in combination with other technical analysis tools, such as trend lines or moving averages, to validate your findings and make more accurate speculations.
Concept of role reversal: A key to strategic trading
Role reversal in support and resistance indicators is another concept for traders. Once a resistance level is breached, it often transforms into support. Similarly, once support is broken, it becomes resistant. Understanding this phenomenon can immensely help adjust your trading strategies in a dynamic market. Like a change in the scene in an engaging play, this role reversal can have critical implications for trading strategies.
Key Takeaways
- Support in forex trading acts like a safety net, preventing prices from falling below a certain point, while resistance acts like a glass ceiling, limiting price increases.
- These levels are a result of supply and demand dynamics in the market.
- Support and resistance can be thought of as zones rather than precise levels, providing traders with flexibility.
- While they’re useful, support and resistance levels are not foolproof and should be used in conjunction with other technical indicators and tools.
- Traders should identify these levels on a line chart, consider the bigger picture, and use other indicators for confirmation.
- Role reversal is an important concept where breached resistance can become support, and vice versa, influencing trading strategies.
- Forex traders should combine support and resistance indicators with other technical analysis tools for a comprehensive trading strategy.
- Relying solely on support and resistance indicators can be risky, as they cannot predict future market movements with certainty.
Conclusion
In summary, support and resistance indicator levels are vital in forex trading, offering insights into potential price reversals and psychological market benchmarks. While not infallible, they are valuable tools when used alongside other technical indicators and an understanding of market sentiment. Traders should view them as zones rather than fixed lines, adapting strategies for dynamic role reversals.
Successful forex trading is an art that requires the skilled blending of these tools, akin to a chef combining spices for a culinary masterpiece. It’s about comprehending market rhythms, adapting, and continuously refining strategies in the ever-changing financial landscape.
Disclaimer: The information contained in this article is provided for educational and informational purposes only and it is not intended to be, nor does it constitute financial, investment, or trading advice. You should not make any financial, investment, or trading decisions based on the information provided in this article without performing your own research or seeking advice from an independent advisor.